For details of experimental protocol, see paper:
Data Use:
CMIP model data are made freely available to the public and the scientific community in the belief that their wide dissemination will lead to greater understanding and new scientific insights. The data are published and freely available on the Earth System Grid (ESGF: https://esgf-node.llnl.gov/projects/cmip6/ ). The Earth System Modelling community makes the following fair use request to ensure that scientists receive fair credit for their work. Data can be freely used in analyses, but in the event of this leading to publication in a journal users are requested to consider if co-authorship from model groups may be appropriate. If the CMIP data are essential to the work, or if an important result or conclusion depends on them, users are encouraged to contact model group representatives and invite possible involvement in any resulting publications. This fair-use request is not intended to be restrictive, but rather to encourage inclusivity and provide a mechanism for scientists to receive due credit for many years of effort building and configuring complex modelling systems.
Simulation Status and Analysis Plans:
Analysis of C4MIP simulations is open to all. Here we try to coordinate analysis to avoid duplication and to foster collaboration. Please add details of planned analysis to the following document: https://docs.google.com/document/d/1xmLxxOwACvqEhCESPhTYwlklK1WQW_O7EoV3AapNMPM/edit
Modelling groups are requested to keep track of simulation status via the following link: docs.google.com/spreadsheets/d/1AVZTNHcZME5xr0_hMbhvZY6z4twk3o3GHMz2Di3ZUN0/edit
Forcings for simulations:
- The N deposition data (baseline and SPP scenarios) will be available from here
https://esgf-node.llnl.gov/projects/input4mips
Temporarily available at:
ftp://ftp.bgc-jena.mpg.de/pub/outgoing/szaehle/c4mip/
- Isotopic data
The historical carbon isotope forcing datasets are described in a GMD paper (Graven et al. 2017) and they are available as a supplement to the paper, as well as through input4mips.
GMD paper: https://www.geosci-model-dev.net/10/4405/2017/gmd-10-4405-2017.pdf
Delta13CO2 data: http://doi.org/10.22033/ESGF/input4MIPs.1601
Delta14CO2 data: http://doi.org/10.22033/ESGF/input4MIPs.1602
Future carbon isotope forcing datasets for six of the SSPs are available here:
Delta13CO2 and Delta14CO2 data: Graven_SSP_D14C_d13C_181126.xlsx
Description of forcing datasets: Graven_SSPisotopeSimDesc_181126.pdf
- Fossil fuel emissions
Fossil fuel emissions are available at:
https://esgf-node.llnl.gov/projects/input4mips
Please note:
1) Total anthropogenic CO2 emissions consist of the sum of all sectors in the "em-anthro" file plus 3-d emissions in the aircraft CO2 emissions file. There are, therefore, two CO2 emissions files for each scenario. Use a sum of them as total emissions to force emission-driven experiments!
2) We found out that cumulative CMIP6 emissions are higher than the Global Carbon Project emissions by ca. 10 PgC, mainly in the period 1950-1999 (see the Table below). An explanation from Steve Smith: "CEDS produces CO2 emissions consistent with all the other species. So while we build on CDIAC assumptions, it is a different methodology because CEDS is fundamentally sector, not fuel, based and results in a somewhat different total."
| Years | CMIP6 emissions | GCP emissions |
| 1850-1899 | 9.70 | 10.52 |
| 1900-1949 | 48.57 | 48.92 |
| 1950-1999 | 225.37 | 214.9 |
| 2000-2014 | 125.56 | 124.76 |
| Total, PgC: | 409.2 | 399.1 |
CMIP6 landcover change emission data
Models without explicit treatment of landuse changes are encouraged to use the following emission data:
- For the esm-historical simulation use the gridded emissions available here:
CMIP6_C4MIP_landuse_emissions.nc.gz (31 MB)
-
For the esm-ssp585 simulation please create land-use emissions by the following method:
- Use the spatial pattern from the final year (2014) of the historical simulation
- Scale the spatial pattern to match the correct annual total from the scenario. Scenario annual totals can be found from this link (https://tntcat.iiasa.ac.at/SspDb/dsd?Action=htmlpage&page=50 ), and are in the table below. Annual values for all years should be created by piece-wise linear interpolation between the years listed:
| Year | 2015 | 2020 | 2030 | 2040 | 2050 | 2060 | 2070 | 2080 | 2090 | 2100 |
MtCO2 | 3517.4 | 3949.7 | 4546.9 | 3435.7 | 2053.0 | 139.4 | -229.9 | -147.9 | -495.4 | -1530.3 |
PgC | 0.9591 | 1.0769 | 1.2397 | 0.9368 | 0.5598 | 0.0380 | -0.0627 | -0.0403 | -0.1351 | -0.4173 |
-
For any other emissions-driven scenario runs you wish to perform outside C4MIP, the same procedure can be followed to scale 2014 patterns by the scenario global total.
/fileadmin/user_upload/c4mip/Jones_Fig_1.png
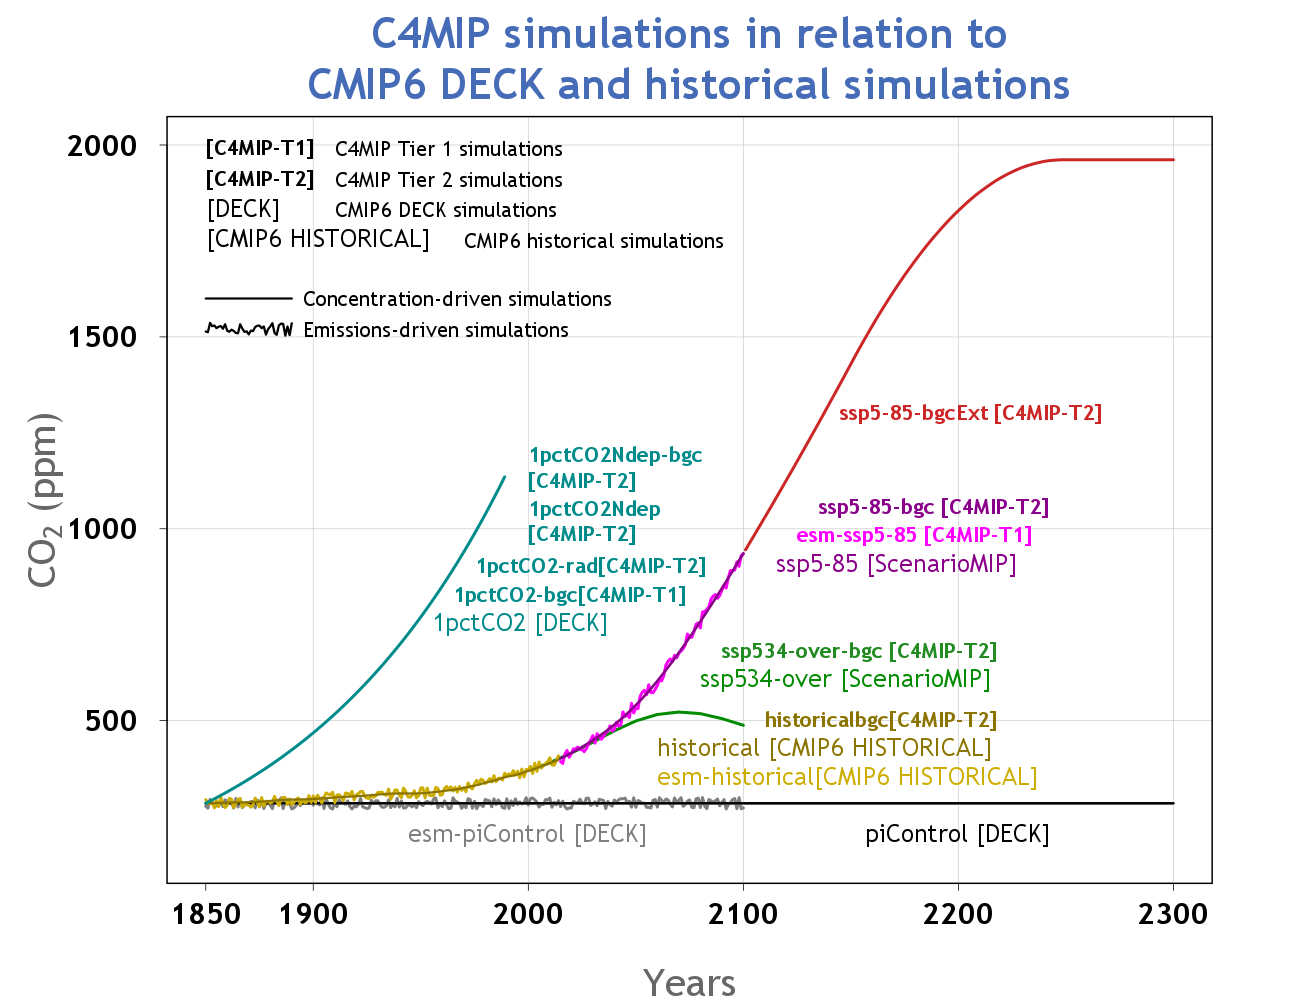
Figure 1 from Jones et al 2016, click image to enlarge.
| Category | Type of Scenario | Emission or concentration driven | Coupling mode | Simulation years | Short name |
|---|---|---|---|---|---|
| Tier 1 | |||||
| 1%BGC | Idealised 1% per year CO2 only, BGC mode | C-driven | CO2 affects BGC | 140 | 1pctCO2-bgc |
| SSP5-8.5 | SSP5-8.5 up to 2100 | E-driven | Fully coupled | 85 | esm-ssp585 |
| Tier 2 | |||||
| 1%RAD | Idealised 1% per year CO2 only, RAD mode | C-driven | CO2 affects RAD | 140 | 1pctCO2-rad |
| 1%COU-Ndep | Idealised 1% per year CO2 only, fully coupled, increasing N-deposition | C-driven | Fully coupled | 140 | 1pctCO2Ndep |
| 1%BGC-Ndep | Idealised 1% per year CO2 only, BGC mode, increasing N-deposition | C-driven | CO2 affects BGC | 140 | 1pctCO2Ndepbgc |
| Hist/SSP5-8.5-BGC | Historical+SSP5-8.5 up to 2300, BGC mode | C-driven | CO2 affects BGC | i. 165 ii. 85 iii. 200 | hist-bgc, ssp585-bgc and ssp585-bgcExt |
| SSP5-3.4-Overshoot-BGC | SSP5-3.4-OS up to 2300 in BGC mode | C-driven | CO2 affects BGC | i. 60 (from 2040-2100)ii. 200 | ssp534-over-bgc, ssp534-overbgcExt |